The ups and downs of CGM
Kit Sturgess MA VetMB PhD CertVR DSAM CertVC FRCVS RCVS, Recognised Specialist in Small Animal Medicine and Advanced Practitioner in Veterinary Cardiology, discusses recent developments in continuous glucose monitoring (CGM) systems which have revolutionised the assessment of glycaemic control in diabetic dogs and cats
Continuous glucose monitoring systems have been used in cats and dogs for over 20 years, but early systems were expensive and difficult to use requiring regular calibration and only generating three to four days of data. In the last 10 years, continuous (flash) glucose monitoring (CGM) systems have become available that do not require expensive equipment or calibration, are easy and reliable to fit, and can provide up to 14 days of data for analysis. These systems have revolutionised diabetic monitoring to the point where it is hard to justify in-clinic glucose curves or home monitoring using portable glucometers. In-clinic glucose measurements poorly reflect glycaemic control at home as patients, particularly cats, can be very stressed resulting in increased gluconeogenesis and heightened insulin resistance. Practically, the frequency of monitoring can miss critical events and can be challenging through the night. It has also become clear that glucose curves can vary substantially day to day (Figure 7) even where the management regime is unchanged, making it hard to make rational decisions on a single 24-hour curve or part thereof.
In-clinic glucose measurements have value in an emergency to rule out hypoglycaemia, when managing patients with diabetic ketoacidosis (DKA) or in diabetics undergoing anaesthesia. In situations where finances do not allow glucose monitoring, spot morning glucose measurements have been used to improve management (Gottlieb et al 2024).
Most veterinary experience of CGM systems has been with the Freestyle Libre made by Abbott currently version 2 and 3 with some use of Dexcom G-7. These systems will link up to the carer’s mobile phone and the latest systems will give real time data. Phones only display limited data and it is worth registering the practice as a clinic that allows remote access and more detailed reporting including trends over time. Sensors can be obtained from the manufacturer or can be purchased online by the owner (Amazon UK was offering FreeStyle Libre 2 at £58 and the Libre 3 at £69.50 [access April 30, 2025]).
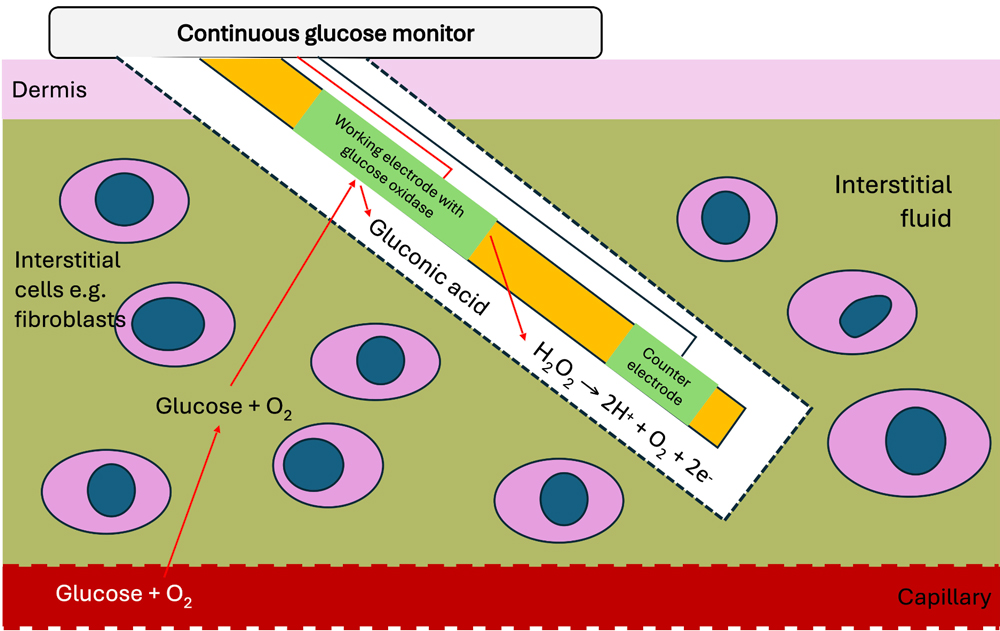
Figure 1: Illustration of how CGM systems sense glucose and measure the level of glucose in the interstitial space.
How do the systems work?
CGM systems measure interstitial glucose which is not necessarily the same as blood glucose at any given moment; they assume normal skin oxygenation and blood flow and hence can be less reliable where there is hypoxia or reduced skin blood flow, e.g., dehydration, hypovolaemia, or anaesthesia. Figure 1 shows how the sensors work – the number of electrons produced (current) is proportional to the amount of glucose in the interstitial space.
Interstitial glucose tends to lag behind blood glucose and does not necessarily pick up rapid change, and also shows a less marked peak with post-prandial hyperglycaemia in dogs. The key value that CGM systems bring is an accurate trend in glucose over a number of days. A variety of studies have compared CGM systems with blood glucose measurements (Figure. 2, Corradini et al 2016). Overall Freestyle Libre tends to underestimate glucose levels compared to blood, except when blood glucose is low (<3mmol/L) when it overestimates. The upper limit for the sensors is relatively low – for Freestyle Libre, it is 19.4-22.2mmol/L although data is recorded up to 27.7mmol/L; lower limit 2.2mmol/L. Above is displayed as ‘Hi’ and below as ‘Lo’ but it is not possible to tell whether this is just above/below or not. The sensors seem less accurate in thin-skinned patients (<5mm) and will not work at all in a small percentage of patients.
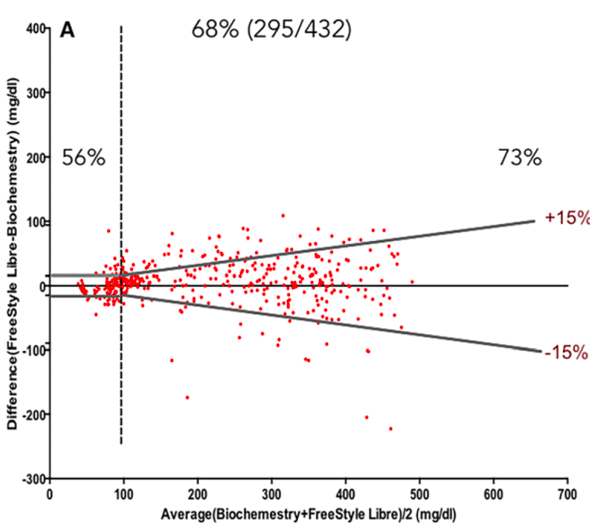
Figure 2: Bland-Altmann plot comparing FreeStyle Libre 2 with portable blood glucose monitor (Accu-Check Aviva Nano) The standard required limits defined by the grey symmetric lines: at 15 mg/dL (0.8mmol/L) from the reference value for glucose determinations <100 mg/dL (5.5mmol/L) and at 15 per cent from the reference for glucose ≥100 mg/dL. Percentages express the number of samples within limits when reference was < or ≥100 mg/dL and for the total number of measurements (central percentage value).
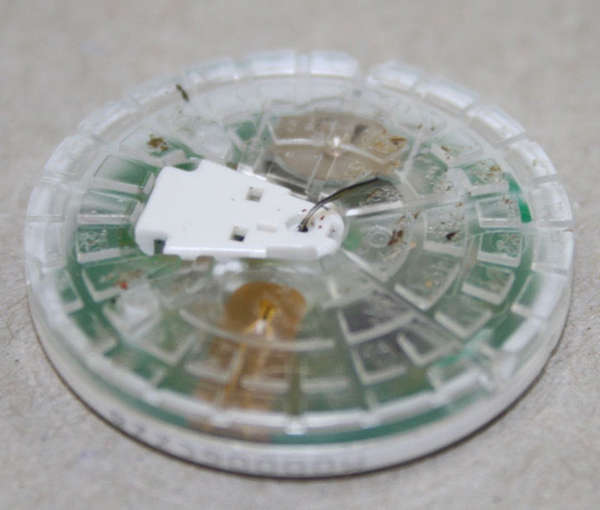
Figure 3: Used freestyle sensor showing the sensing electrode that sits in the interstitial space.
When should they be used?
One sensor placement is rarely enough to work out what is going on and how to fix it. Placement is of less value in patients showing minimal response to insulin and in cats on sodium-glucose cotransporter-2 (SGLT-2) inhibitors such as velagliflozin (Senvelgo).
Placement is most valuable where there is:
- initial stabilization;
- a poorly responsive on-going case;
- marked day-day or within-day variability;
- a need to allow more aggressive insulin management;
- a previously stable case where control has been lost;
- cats enter diabetic remission.
Placement
The key to getting value from the sensor is appropriate placement – this means site and careful preparation. Multiple sites are used and may be required if multiple sensors are fitted:
- neck;
- thoracic - most accurate but shortest functional life;
- interscapular area; and,
- lumbar muscles.
Sensors (Figure 3) should be fitted where there are no pre-existing skin lesions. Careful close clipping of the hair using sharp, well-maintained clippers is essential. The area should then be degreased using wipes and the alcohol left to evaporate. The sensor is deployed in a spring-loaded device that has a needle with a slit in the side which guides the sensor electrode into the interstitial space and then can be removed with the sensor electrode slipping out from the centre of the needle through the slit. Deployment makes a reasonably loud bang so patients should be firmly held. Small dogs and cats tend to dip away from the sensor when it is deployed so supporting them from the opposite side is important. The glue takes a little while to start bonding, so it is important that the deployment device is left for a few seconds before removing. There is a small adhesive dressing that sticks the sensor to the skin, some clinicians will add tissue glue to try and increase security. Over dressing and body stocking can also be used but can irritate the patient, increasing the risk of them trying to remove the sensor.
Very few risks have been identified with placement. The main adverse reaction is skin inflammation (Figure 4) which is usually mild and self-resolving when the sensor is removed and occurs in around 40 per cent of placements. Much less commonly, skin erosions and abscess formation occurs. There is one reported case of suspected pneumothorax although it is hard to see how this would have occurred (Sia & Sun 2025) given the needle length.
Life span of the FreeStyle Libre is theoretically 14 days; studies have shown to expect seven to 10 days of useable data for most patients. A study in 41 cats showed a median life span of 10 days (Knies et al 2022).
Owner perspective
Once fitted, most owners appreciate the benefit of having the sensor and the comfort of being able to obtain a glucose level at any time. It is important that clear parameters are set in terms of when to call the practice for help and support especially should the interstitial glucose be reading very low. In these circumstances, a blood glucose comparison is important. Over 80 per cent of owners report that CGM systems were less stressful than BG curves, 92 per cent reported better control. Main concerns were costs and keeping sensor attached; cats seemed to tolerate sensors less well than dogs from the owner perspective.
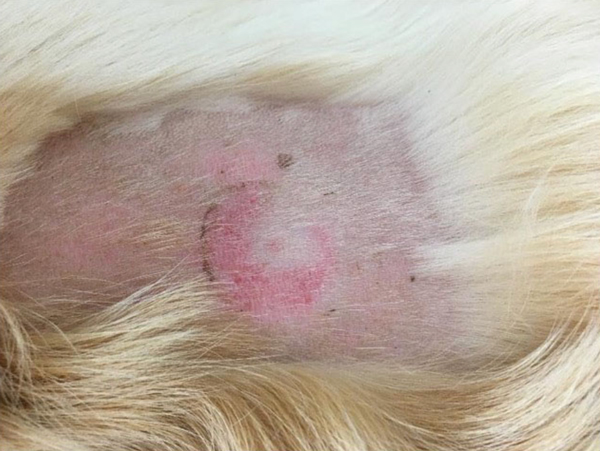
Figure 4: Mild skin inflammation visible after removing a Freestyle sensor.
Interpreting the results
Interstitial glucose is one parameter in a complex system of glycaemic control (Figure 5). So even with much more data, deciding what factors are responsible for the resulting glucose curve can be challenging. Dividing the potential causes into key areas can be helpful.
- Insulin from the bottle into the patient – timing, dose rate, condition of the insulin, injection site etc.
- Movement of the insulin from the injection site to the insulin receptor on the cell surface – absorption of the insulin from the injection site, metabolism of the insulin, binding to the receptor.
- Receptor response – level of insulin resistance; how much is required to open the Glut-4 channel?
- Endogenous insulin production and glucotoxicity – particularly relevant in patients with type II-like diabetes where there are sufficient pancreatic islet cells to maintain glycaemic control, but their function is impaired by the hyperglycaemia.
- Non-insulin related factors – diet, gluconeogenesis, level of exercise, use of glucose by tissues that do not require insulin for the cells to take in glucose (brain, red blood cells, kidney, muscles at exercise).
Generally, the author will fit a sensor and observe the glucose curve over three to four days to get an understanding of the natural day-day variation in glucose values and whether the pattern is broadly similar (i.e., timing of peak and nadir) or varies a lot. Then, based on this, I make an adjustment (usually to dose in the first instance) and then observe the impact. If the sensor lasts for a reasonable period, then it is usually possible to make two changes and observe the impact.
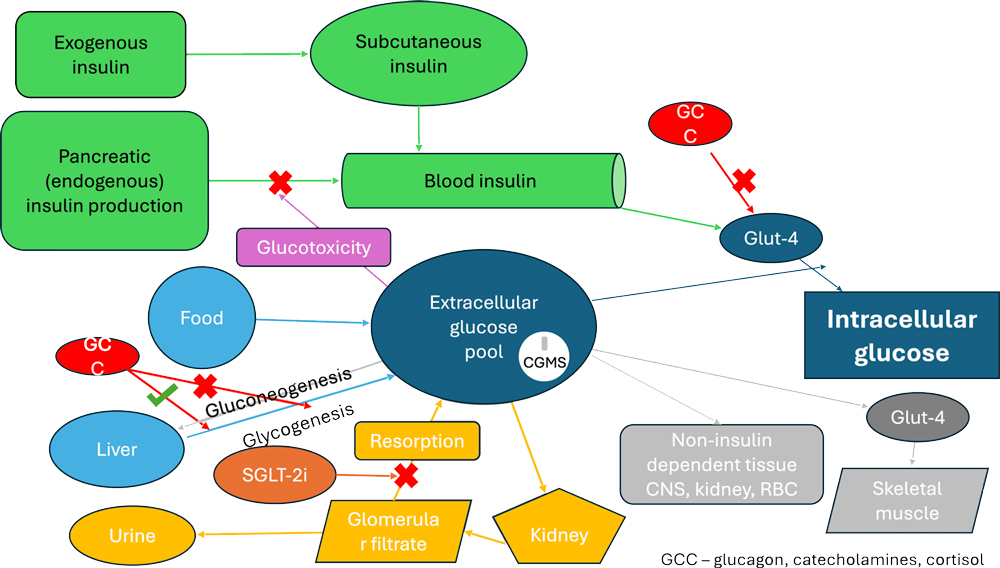
Figure 5. Diagram showing main impacts on extracellular glucose pool.
While the daily curve is of value, the key is comparing curves – looking at the average over a number of days with the spread of blood glucose measurements at a particular time (Figure 6) and the calculated average blood glucose (area under the curve) following a change to see if this is falling, see Figure 7. As with a traditional curve, the key points are:
- Nadir – when does it occur following injection and feeding (dogs), how low does it last, does it occur at approximately the same time each day, what is the range of values?
- Duration of action – is the insulin appearing to have a significant effect for at least 75 per cent of the inter-insulin period?
- Are there periods of rapid fall (NB: on the phone view in portrait, the glucose can appear to have fallen quickly but actually, because of the scale, it has taken a number of hours)?
- Is the daytime and night-time pattern the same? If not, is there a different routine e.g., exercise timing and duration in dogs?
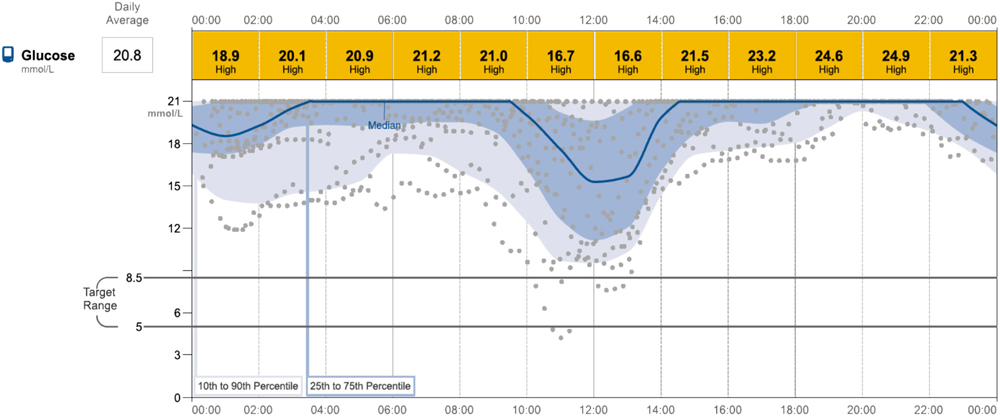
Figure 6: Sensor read-out in a dog with poor night-time response likely associated with inadequate absorption of insulin.
Making changes
Before making changes, it is critical that the patient’s clinical signs are reviewed. Ideally, the owner will have been keeping a diary as this will give more accurate details over a number of weeks rather than relying on the owner’s memory which tends to focus on the last few days. Key questions are around thirst and appetite, weight (loss, gain, stable), exercise tolerance, and activity/sleeping.
If the clinical signs suggest that improvements can be made, then decide whether it is non-insulin dose/type factors e.g., routine, intercurrent disease, etc. or insulin dose/type-related issues. If the latter, is the potential solution increasing/decreasing the dose (Figure 8)? Or is the nadir about right and duration too short (Figure 9), in which case a change of insulin may be appropriate. Increasing the dose will lower the nadir and increase duration of action. It is outside the scope of this article to undertake a detailed discussion of the various glucose curve patterns that can be observed and the approach to resolving them.
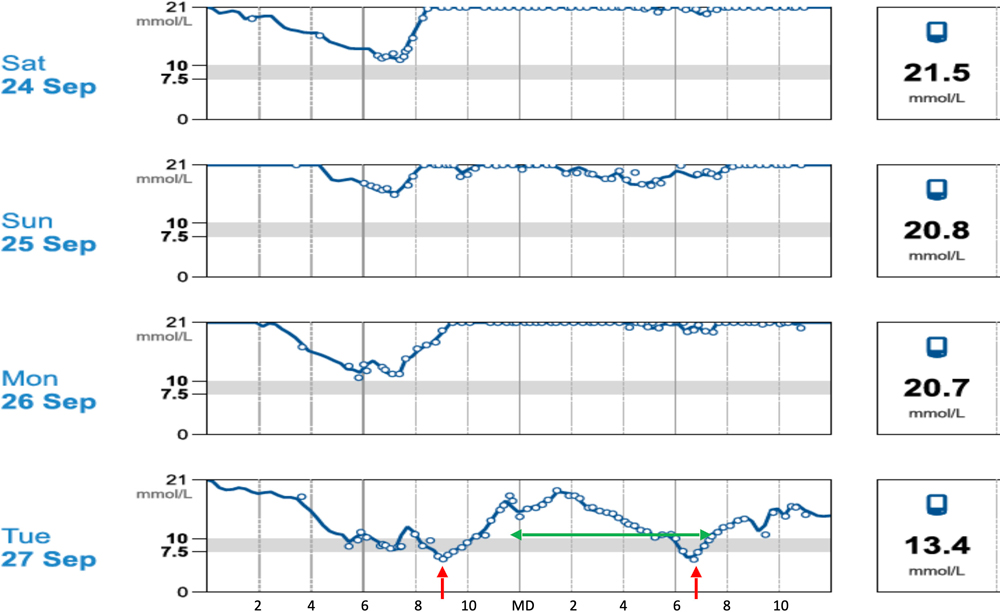
Figure 7: Day-day variation in glucose curve in a patient given consistently daily insulin. Red arrows nadir, green arrow duration action.

Figure 8: Average blood glucose over 10 days showing range – in this patient, a cat with acromegaly, there is no clear nadir or duration of action.
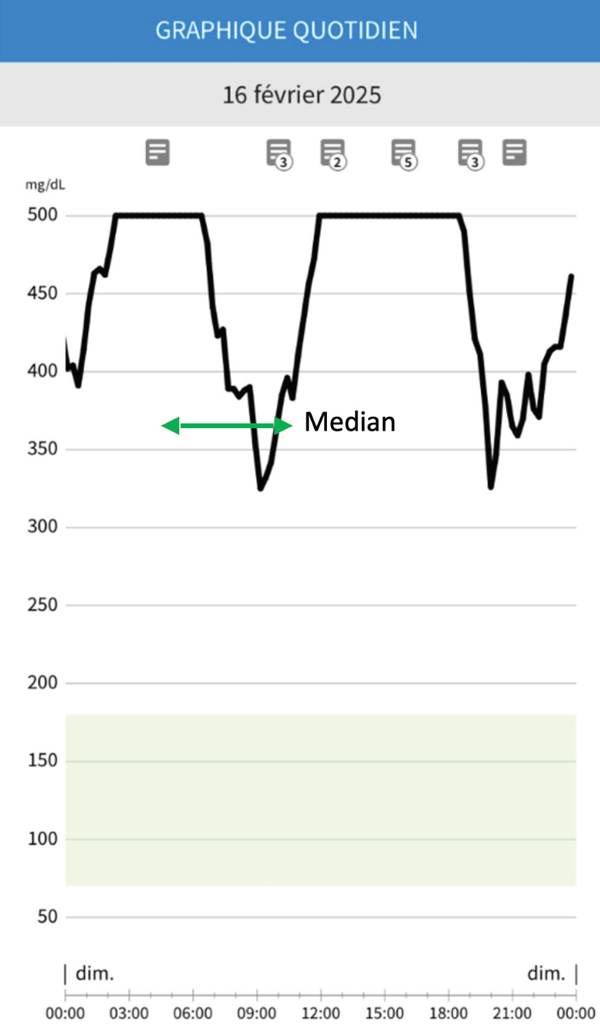
Figure 9: Short duration of action (green arrow).
Summary
Continuous glucose monitoring (CGM) systems are easy to fit and give rich data over a number of days, highlighting the patient’s ‘normal’ day to day variability and allowing the impact of changes in management to be better assessed. For the vast majority of patients, CGM is much more preferable to traditional blood glucose monitoring methods. CGM systems monitor interstitial glucose and have shown good correlation with blood glucose measurements. Absolute values may not be identical, but they accurately reflect glycaemic control allowing better assessment of the trends through the day and give more robust data on the duration of action of insulin as well as the timing and depth of the nadir. The sensors are well-tolerated by cats and dogs; localised skin inflammation is not uncommon but significant adverse events are very rare. From a cost perspective, although each sensor is relatively expensive, they deliver far better data and, for most practices, compare favourably with a single in-clinic glucose curve. Most pet owners find using CGM systems less stressful compared to traditional methods and report better control of their pets’ diabetes.
Corradini S, Pilosio B, Dondi F, Linari G, Testa S, Brugnoli F, Gianella P, Pietra M, Fracassi F. Accuracy of a Flash Glucose Monitoring System in Diabetic Dogs. J Vet Intern Med. 2016 Jul;30(4):983-8. doi: 10.1111/jvim.14355. Epub 2016 Jun 18. PMID: 27318663; PMCID: PMC5094557.
Gottlieb S, Rand JS, Anderson ST. Frequency of diabetic remission, predictors of remission and survival in cats using a low-cost, moderate-intensity, home- monitoring protocol and twice-daily glargine. J Feline Med Surg. 2024 Apr;26(4):1098612X241232546. doi: 10.1177/1098612X241232546. PMID: 38661475; PMCID: PMC11103314.
Knies M, Teske E, Kooistra H. Evaluation of the FreeStyle Libre, a flash glucose monitoring system, in client-owned cats with diabetes mellitus. J Feline Med Surg. 2022 Aug;24(8):e223-e231. doi: 10.1177/1098612X221104051. Epub 2022 Jun 28. PMID: 35762266; PMCID: PMC9315169.
Sia WK, Sun JA. Pneumothorax suspected secondary to continuous glucose monitor placement in a dog. Can Vet J. 2025 Jan;66(1):58-63. PMID: 39781420; PMCID: PMC11705176.
1. What do continuous glucose monitors measure?
- Blood glucose
- Venous glucose
- Capillary glucose
- Interstitial glucose
- Subcutaneous glucose
2. Which is the most common adverse reaction to CGM placement?
- Skin inflammation
- Skin infection
- Skin abscessation
- Subcutaneous emphysema
- Sepsis
3. When blood glucose levels are low (< 3mmol/L) does the CGM value tend to
- Be accurate
- Over-estimate blood glucose
- Under-estimate blood glucose
- Give a Lo (low) reading
- Become inaccurate
4. Which of the following circumstances has not been associated with reduced reliability of CGM systems?
- Low interstitial oxygen levels
- Thin skinned patients
- Dehydrated or hypovolaemic patients
- Anaesthetised patients
- Hot weather
5. Increasing the dose of insulin will affect the glucose curve by:
- Reducing the nadir
- Reducing the duration of action
- Increasing the duration of action
- Reducing the nadir and increasing the duration of action
- Making the nadir occur sooner after the insulin injection


